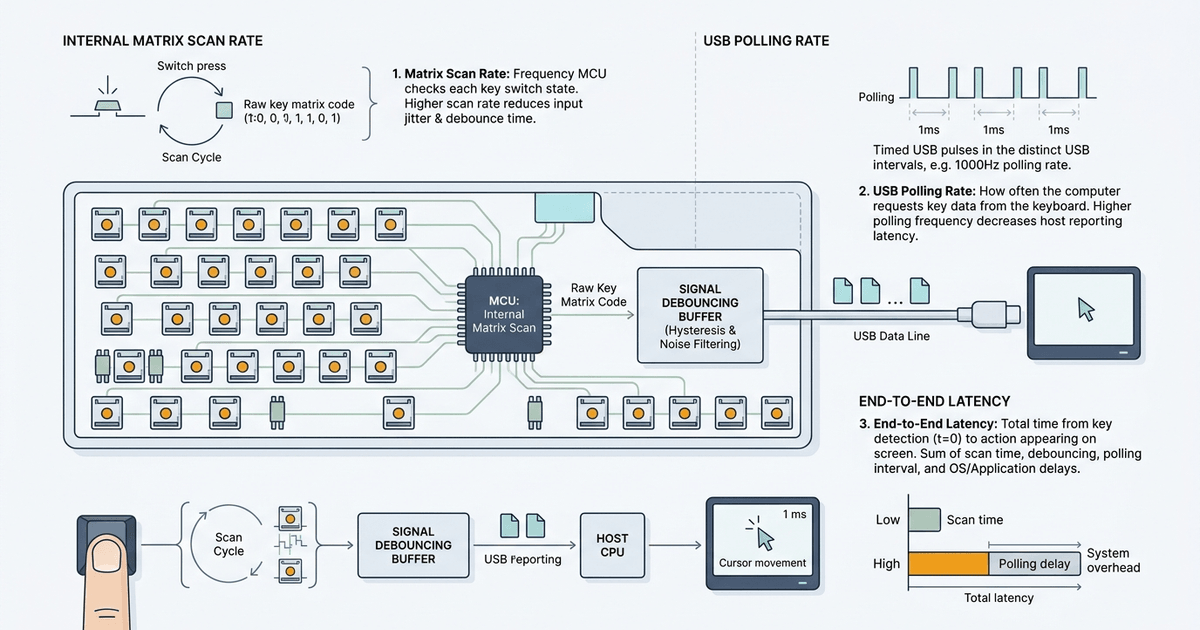
If you browse modern gaming peripheral spec sheets, you will be bombarded with astronomical claims: “8000Hz HyperPolling,” “256kHz Internal Scan Rate,” and “Sub-0.1ms Input Latency.”
Yet competitive players regularly notice a puzzling paradox:
- Plugging in a keyboard with an 8000Hz polling rate often feels virtually identical to a quality 1000Hz keyboard.
- But switching to a Hall Effect magnetic keyboard with a 0.1mm actuation point and Rapid Trigger feels dramatically more responsive—even when locked to a standard 1000Hz polling rate.
Why does an “8000Hz” keyboard fail to deliver the 8x speed boost that marketing implies? The answer lies in the fundamental difference between internal scan rate, switch debouncing delay, USB polling rate, and system click-to-photon latency.
This engineering-grade guide demystifies the entire input pipeline. We break down the physics of switch detection, explain where input bottlenecks actually hide, and show you how to diagnose your setup using our free Keyboard Latency Test Tool.
1. Quick Summary: Polling Rate vs. Scan Rate vs. Latency
Before analyzing circuit schematics and USB packet headers, here is the core distinction summarized at a glance:
| Specification | Where It Happens | Primary Function | Typical Hardware Range | Real Impact on Speed |
|---|---|---|---|---|
| Scan Rate | Inside the keyboard MCU | Checks the physical switch matrix or analog sensors to detect key state changes. | 1,000 Hz – 32,000+ Hz | Very High: Sets the floor for first-detection speed and phase jitter. |
| Debounce Filter | Inside keyboard firmware | Delays or locks input to filter out mechanical metal contact chatter. | 0 ms (Optical/HE) to 15 ms (Mechanical) | Critical: Often introduces 5× to 10× more delay than the entire USB bus. |
| Polling Rate | Across the USB bus | How frequently the host computer requests and receives verified key state reports. | 125 Hz – 8,000 Hz | Moderate: Reduces average transmission wait time from 0.5ms (1kHz) to 0.06ms (8kHz). |
| End-to-End Latency | Full system pipeline | Total time elapsed from your physical finger movement to on-screen pixel presentation. | 3.0 ms – 30.0+ ms | Absolute Truth: The only number that actually dictates responsiveness in-game. |
The Golden Rule of Input Speed:
Detection must lead transmission. If a keyboard polls over USB at 8000Hz but its internal microcontroller only scans its key matrix at 1000Hz, seven out of every eight USB packets are empty duplicates carrying stale data.
2. What Is Keyboard Scan Rate? (Internal Matrix Physics)
Scan rate (measured in Hertz or kilohertz) refers to how many times per second the keyboard’s internal microcontroller unit (MCU) interrogates its physical switches to determine whether any key has been pressed, held, or released.
This process happens entirely inside the keyboard hardware before a single byte of data is sent to your computer.
┌────────────────────────────────────────────────────────────────────────┐
│                        KEYBOARD HARDWARE & MCU                         │
│                                                                        │
│   [Switch Matrix Grid] ──> [MCU Scan Loop] ──> [Debounce Filter]       │
│      Rows & Columns           1kHz – 8kHz           0ms – 10ms         │
└───────────────────────────────────────────────────┬────────────────────┘
                                                    │ Verified HID Report
                                                    ▼
┌────────────────────────────────────────────────────────────────────────┐
│                        USB BUS / HOST COMPUTER                         │
│                                                                        │
│   [USB Interrupt Pipe] ──> [Host OS Driver] ──> [Game Engine Frame]    │
│      125Hz – 8000Hz             Raw Input          DirectX / Vulkan    │
└────────────────────────────────────────────────────────────────────────┘
How Traditional Matrix Scanning Works
A standard full-size keyboard has 104 keys. If every key had its own dedicated input pin on the microcontroller, the chip would require 104 individual GPIO pins—making the board expensive, bulky, and power-hungry.
Instead, keyboards arrange keys into an electrical grid called a switch matrix, typically wired into rows and columns (e.g., 16 columns × 8 rows = 128 possible intersections):
- The Strobe Cycle: The MCU drives Column 0 to a low voltage state while keeping all other columns high.
- The Read Cycle: The MCU reads the input voltage across all 8 rows simultaneously. If Key “W” at Column 0, Row 2 is physically closed, electrical current flows, pulling Row 2 low.
- The Matrix Progression: The MCU steps to Column 1, repeats the read, steps to Column 2, and continues until all columns have been inspected.
- The Scan Period: One full inspection cycle of all rows and columns constitutes one matrix scan.
If an MCU completes this full column-strobe cycle in 1 millisecond, the keyboard has a 1,000Hz matrix scan rate. If high-performance firmware and a faster 32-bit ARM MCU (such as an STM32 or RP2040) strobe the matrix in 250 microseconds, the keyboard achieves a 4,000Hz scan rate.
To learn more about how matrix circuitry prevents ghosting and handles key combinations, read our comprehensive N-Key Rollover (NKRO) and Ghosting Guide.
Mechanical vs. Hall Effect (Analog) Scan Rates
Matrix scanning behaves very differently depending on switch architecture:
- Traditional Contact Switches (Cherry MX, Gateron, Kailh): The MCU only needs to register a binary state: switch open (0) or switch closed (1). Once the circuit closes, however, physical contact chatter requires a firmware debounce delay.
- Optical Switches: An infrared light beam is interrupted or allowed through when the stem travels down. There are no bouncing metal contacts, allowing immediate zero-delay registration at the scan frequency. Read our Optical vs. Mechanical Switches Latency Guide for laboratory timing benchmarks.
- Hall Effect Magnetic Switches (Wooting, Razer Analog, SteelSeries OmniPoint): There are no electrical contact leaves at all. Instead, a permanent magnet inside the stem moves past a Hall effect sensor on the PCB. The sensor outputs a continuous analog voltage proportional to magnetic flux.
Because Hall Effect switches are analog, the MCU cannot simply check a digital high/low pin. It must run multi-channel Analog-to-Digital Converters (ADCs) that sample the continuous position of all 61 to 104 keys simultaneously.
In analog keyboards, scan rate represents the ADC position sampling frequency. A high scan rate (such as 8kHz) allows features like Rapid Trigger—where a key resets dynamically the instant your finger moves upward by as little as 0.1mm—to respond instantaneously without waiting for a fixed reset leaf. For a detailed breakdown of magnetic flux and rapid reset physics, see our Hall Effect Magnetic Switches vs. Mechanical Guide.
3. What Is Keyboard Polling Rate? (USB Communication)
While scan rate is about detecting the press inside the keyboard, polling rate is about transmitting that verified data across the USB cable to the operating system.
Keyboard polling rate is governed by the USB Human Interface Device (HID) protocol:
- Keyboards operate as USB Interrupt Endpoints. Unlike bulk storage transfers, interrupt endpoints reserve dedicated transmission bandwidth on the USB bus.
- The keyboard does not push data at random moments. Instead, the host operating system’s USB root controller periodically asks the keyboard: “Do you have a new input packet to report?”
- The frequency of these host requests is defined by the device descriptor’s
bIntervalparameter, measured in Hertz (Hz).
Host Controller  ──[ Poll Token: "Any new keys?" ]──>  Keyboard MCU
Host Controller  <──[ HID Report: Keypress 0x1A ]────  Keyboard MCU
Polling Rate Intervals & Theoretical Transmission Delays
The table below illustrates the physical polling interval (in milliseconds) and the resulting average transmission delay:
| Polling Rate (Hz) | USB Protocol Class | Interval Between Polls | Average Transmission Wait Time | Maximum Transmission Wait Time |
|---|---|---|---|---|
| 125 Hz | USB 1.1 / 2.0 Full-Speed | 8.0 ms | 4.0 ms | 8.0 ms |
| 250 Hz | USB 2.0 Full-Speed | 4.0 ms | 2.0 ms | 4.0 ms |
| 500 Hz | USB 2.0 Full-Speed | 2.0 ms | 1.0 ms | 2.0 ms |
| 1,000 Hz | USB 2.0 Full-Speed standard | 1.0 ms | 0.5 ms | 1.0 ms |
| 2,000 Hz | USB 2.0 High-Speed microframe | 0.5 ms | 0.25 ms | 0.5 ms |
| 4,000 Hz | USB 2.0 High-Speed microframe | 0.25 ms | 0.125 ms | 0.25 ms |
| 8,000 Hz | USB 2.0 High-Speed microframe | 0.125 ms | 0.0625 ms | 0.125 ms |
The “Average Wait Time” Reality
Because your finger presses a key at completely random, asynchronous moments relative to the USB clock cycle:
- If you press a key right before a USB polling window, transmission delay is nearly 0.0 ms.
- If you press a key immediately after a USB polling window just closed, the packet must sit in the keyboard’s buffer until the next poll arrives.
Therefore, the average USB polling transmission latency is half the polling interval ($T_{\text{poll}} / 2$).
When moving from a standard 1,000Hz gaming keyboard to an ultra-enthusiast 8,000Hz keyboard, the true theoretical saving in average communication latency is:
$$0.5\text{ ms} - 0.0625\text{ ms} = 0.4375\text{ ms}$$
That is a maximum saving of less than half a millisecond. To explore whether this fractional gain translates to measurable wins in competitive shooters, consult our dedicated 1000Hz vs. 8000Hz Keyboard Polling Rate Guide.
4. The Critical Difference: Where Detection Meets Transmission
To easily visualize how scan rate and polling rate interact, consider a real-world logistics analogy:
- The Factory Floor (Scan Rate): How often factory workers inspect conveyor belts for finished packages. A fast scan rate means a product is boxed the instant it comes off the line.
- The Delivery Truck (Polling Rate): How often the freight courier pulls up to the loading dock to transport packages to the customer.
- Delivery Time (Total Latency): The total time from when assembly starts until the package lands on the customer’s desk.
If the delivery truck pulls up every 15 minutes (8000Hz polling rate), but the factory workers only box finished items once every 2 hours (slow scan rate or slow debouncing), the truck leaves empty on almost every run. The customer receives their package no faster than if the truck visited once an hour.
The Nyquist-Shannon Bottleneck: Why Scan Rate Must Lead
In digital signal processing, the Nyquist-Shannon sampling theorem states that a discrete recording system must sample a continuous signal at a rate greater than twice its highest frequency component to avoid aliasing and phase distortion.
In keyboard input architectures, a related synchronization principle applies:
Scenario A: 8000Hz Polling with 1000Hz Internal Scan Rate (Marketing Trap)
────────────────────────────────────────────────────────────────────────
Scan:   [Scan 1]─────────────────────────────>[Scan 2]
Poll:   [P1]──[P2]──[P3]──[P4]──[P5]──[P6]──[P7]──[P8]
Data:   [New] [Dup] [Dup] [Dup] [Dup] [Dup] [Dup] [New]
Result: 7 out of 8 USB reports transmit identical stale data. Zero detection gain.

Scenario B: 8000Hz Internal Scan with 1000Hz Polling (Clean Detection)
────────────────────────────────────────────────────────────────────────
Scan:   [S1]──[S2]──[S3]──[S4]──[S5]──[S6]──[S7]──[S8]
Poll:   [Poll 1]─────────────────────────────>[Poll 2]
Result: MCU detects keypress within 0.125ms, queuing fresh packet for next poll.

Scenario C: 8000Hz Scan with 8000Hz Polling (True Synchronized Speed)
────────────────────────────────────────────────────────────────────────
Scan:   [S1]──[S2]──[S3]──[S4]──[S5]──[S6]──[S7]──[S8]
Poll:   [P1]──[P2]──[P3]──[P4]──[P5]──[P6]──[P7]──[P8]
Result: Maximum responsiveness, minimal phase jitter, sub-millisecond pipeline.
If the internal scan rate does not match or exceed the USB polling rate, high polling Hz is completely wasted. True low-latency engineering requires high scan frequency inside the MCU first, followed by a synchronized high polling rate to transmit that state without queue buffering delay.
5. The Hidden Elephant: Switch Debouncing & Actuation Delay
Many gamers hyper-focus on whether their keyboard polls at 1000Hz or 8000Hz while completely ignoring the largest latency penalty on their desk: mechanical contact bounce.
Why Mechanical Switches Bounce
When two flexible metal contact leaves inside a mechanical switch (e.g., Cherry MX, Gateron, Outemu) slam together, they do not cleanly fuse into an electrical connection. Because of physical elasticity, the metal leaves collide, bounce apart, collide again, and vibrate for several milliseconds before establishing stable electrical continuity.
To an unshielded microcontroller running a fast 8000Hz scan loop, those initial oscillations look like someone pressing and releasing the key 10 to 30 times in the span of 3 milliseconds. This phenomenon is called switch chatter.
To prevent phantom double-clicks and repeating letters, keyboard firmware must implement a debounce algorithm. If you are experiencing repeating keystrokes right now, check your hardware using our Mechanical Keyboard Chattering Fix Guide.
Debounce Algorithms and Their Latency Cost
| Debounce Method | How It Works | Initial Press Latency | Release / Re-actuation Penalty | Chatter Protection |
|---|---|---|---|---|
| Defer / Symmetric Debounce | MCU detects contact, waits a fixed period (e.g., 5ms) to ensure signal stabilizes before sending report. | High (+5ms to +15ms) | High (+5ms to +15ms) | Maximum (Immune to chatter) |
| Eager PR (Press) / Asymmetric | MCU sends keypress immediately on the very first electrical spike, but locks out release/repress for $X$ ms. | Low (0ms added) | High (+5ms to +10ms lockout) | Moderate (Fast press, slow reset) |
| Noise Filtering / Noise Cancel | Uses adaptive hysteresis thresholds across multiple matrix scans to confirm transition. | Moderate (+2ms to +4ms) | Moderate (+2ms to +4ms) | High |
| Contactless (Optical & Hall Effect) | Light beam or magnetic flux is sampled. No physical metal collision exists. | Zero (0.0 ms) | Zero (0.0 ms) | Perfect (Zero chatter possible) |
Here is the crucial reality check: If your mechanical keyboard uses a standard conservative 8ms debounce delay, upgrading your polling rate from 1000Hz to 8000Hz reduces polling delay from 0.5ms to 0.06ms—leaving 8ms of debounce delay untouched.
That is why switch selection (optical or magnetic switches with zero debounce) has ten times more impact on real responsiveness than jumping from 1000Hz to 8000Hz polling rate.
6. The Complete Keystroke Latency Pipeline
Input latency is not a single number on a box; it is an end-to-end chain running from your finger muscles to the pixels glowing on your monitor.
Below is the complete architectural breakdown of the keystroke journey:
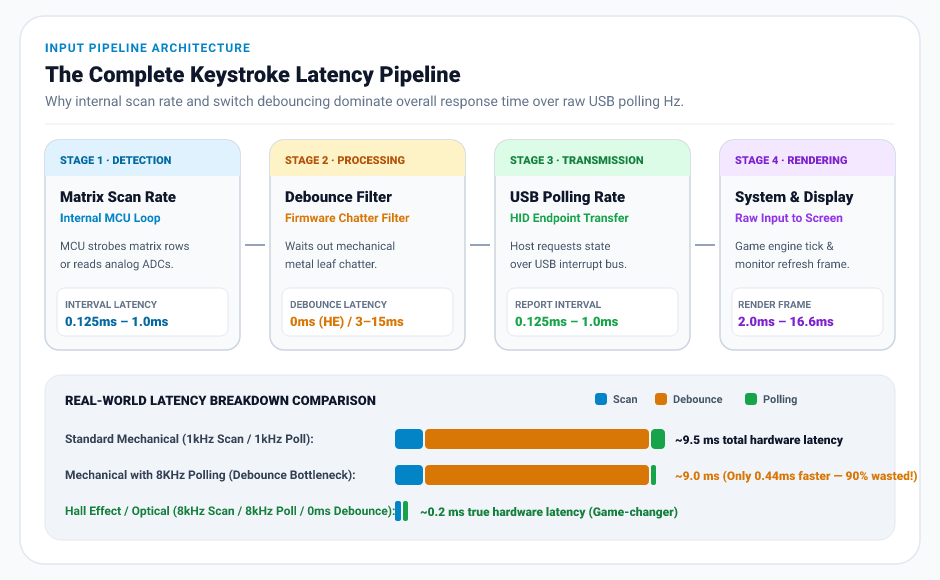
The 8 Stages of Keystroke Latency
Stage 1: Physical Travel Time (5.0ms – 25.0ms)
The mechanical time required for your finger to depress the keycap from its resting position down to the electrical actuation point.
- Standard mechanical switch: 2.0mm pre-travel distance (~10ms–18ms depending on finger velocity).
- Speed switches: 1.0mm–1.2mm pre-travel (~5ms–8ms).
- Hall Effect switches set to 0.1mm actuation: Instantaneous reaction (~1ms–2ms).
Stage 2: Matrix Scan & Detection Interval (0.05ms – 1.0ms)
The internal delay while the keyboard’s MCU cycles through rows and columns or samples analog ADCs to detect that a switch has closed.
- 1,000Hz scan rate: 0.0ms – 1.0ms (0.5ms average).
- 8,000Hz scan rate: 0.0ms – 0.125ms (0.06ms average).
Stage 3: Firmware Debounce Filtering (0.0ms – 12.0ms)
The firmware filter verifying electrical continuity.
- Optical / Hall Effect switches: 0.0ms.
- Eager mechanical firmware: 0.0ms on first press (delays release).
- Conservative mechanical firmware: 5.0ms – 12.0ms.
Stage 4: Microcontroller Processing & USB Packet Assembly (0.05ms – 0.2ms)
The MCU encodes the active key into an 8-byte standard HID keyboard report (modifier byte, reserved byte, and up to 6 key array bytes for 6KRO) or a custom bitmapped report for full NKRO.
Stage 5: USB Transmission Window (0.06ms – 4.0ms)
The packet waits in the device endpoint buffer until the host USB root hub executes its scheduled interrupt transaction.
- 125Hz: 0.0ms – 8.0ms (4.0ms average).
- 1,000Hz: 0.0ms – 1.0ms (0.5ms average).
- 8,000Hz: 0.0ms – 0.125ms (0.06ms average).
Stage 6: OS HID Subsystem & Driver Processing (0.1ms – 0.5ms)
The host CPU receives an interrupt request (IRQ), processes the USB packet in an Interrupt Service Routine (ISR), queues a Deferred Procedure Call (DPC), and Windows/Linux/macOS translates the HID usage code into a virtual key scancode.
Stage 7: Game Engine Input Sampling & Simulation Tick (1.5ms – 16.6ms)
Modern games (using Windows WM_INPUT or DirectInput Raw Input) sample keyboard buffers during their frame simulation tick.
- At 60 FPS (16.6ms frame time): An input may wait up to 16.6ms before the engine calculates game physics.
- At 240 FPS (4.16ms frame time): Input is processed within 4.1ms.
- At 500+ FPS in competitive CS2 or Valorant: Input is sampled within 2ms.
Stage 8: GPU Render Queue & Monitor Presentation (2.0ms – 14.0ms)
The GPU renders the frame, passes it to the display buffer, and the monitor refreshes its pixels:
- 60Hz monitor: 16.6ms refresh interval + pixel response time.
- 144Hz monitor: 6.94ms refresh interval.
- 240Hz monitor: 4.16ms refresh interval.
- 540Hz OLED monitor: 1.85ms refresh interval + sub-0.1ms pixel response.
Real-World Latency Comparison by Keyboard Class
The table below contrasts real measured hardware latency (Phases 1–5, excluding monitor and game engine) across different keyboard configurations:
| Keyboard Class | Switch Mechanism | Matrix Scan Rate | Debounce Delay | USB Polling Rate | Hardware Input Latency |
|---|---|---|---|---|---|
| Budget Office Keyboard | Rubber Dome / Membrane | 125 Hz | 10.0 ms | 125 Hz | 18.0 ms – 26.0 ms |
| Standard Mechanical | Cherry MX / Gateron | 1,000 Hz | 6.0 ms (Defer) | 1,000 Hz | 7.5 ms – 9.0 ms |
| Tuned Gaming Mechanical | Speed Silver (Eager) | 1,000 Hz | 1.0 ms (Eager) | 1,000 Hz | 2.0 ms – 3.5 ms |
| 8000Hz Mechanical | Mechanical (Standard) | 1,000 Hz | 6.0 ms | 8,000 Hz | 6.8 ms – 8.2 ms (Minimal gain) |
| Optical Gaming Keyboard | Razer / SteelSeries Optical | 4,000 Hz | 0.0 ms (Contactless) | 4,000 Hz | 0.8 ms – 1.4 ms |
| Hall Effect + Rapid Trigger | Wooting / Razer Analog | 8,000 Hz (ADC) | 0.0 ms (Contactless) | 8,000 Hz | 0.3 ms – 0.8 ms (Elite benchmark) |
7. Practical Gaming & Typing Assessment: Does It Actually Matter?
Now that we have separated the physics from the marketing claims, how does this translate into everyday gaming and typing?
┌────────────────────────────────────────────────────────────────────────┐
│                        COMPETITIVE ADVANTAGE                          │
│                                                                        │
│   Switch Travel Distance (0.1mm vs 2.0mm)  ═══════════════> [Huge]     │
│   Rapid Trigger Dynamic Reset               ═══════════════> [Huge]     │
│   Zero Debounce Delay (Optical / Magnetic) ═══════════════> [High]     │
│   High Matrix Scan Rate (≥2kHz ADC)        ═══════════════> [Medium]   │
│   8000Hz Polling vs 1000Hz Polling         ═════> [Low - 0.4ms gain]   │
└────────────────────────────────────────────────────────────────────────┘
1. First-Person Shooters (Valorant, CS2, Overwatch)
In tactical shooters, movement mastery depends heavily on counter-strafing—releasing the “A” key while tapping the “D” key to stop player momentum instantly and bring weapon accuracy to 100%.
- Where Polling Rate Helps: An 8000Hz polling rate reduces worst-case frame variance by ~0.4ms. While welcome, human visual reaction time is ~150ms–200ms, making 0.4ms subtle on its own.
- Where Scan Rate & Switch Tech Dominate: Traditional mechanical switches require your finger to lift 1.5mm to 2.0mm upward until the spring passes the reset leaf. Hall Effect switches with Rapid Trigger reset the key the moment your finger begins moving upward by 0.1mm. That shaves 15ms to 30ms off your counter-strafe—an advantage sixty times larger than jumping from 1000Hz to 8000Hz polling!
2. Rhythm Games (osu!, StepMania, Beatmania)
Rhythm games are the ultimate crucible for keyboard latency. In osu!, elite difficulty mods (OD10 and OD11) shrink the window for a perfect “300” score down to just ±13.5 milliseconds.
- In rhythm gaming, input jitter (variance) matters far more than raw average speed.
- If a keyboard polls at 125Hz, your inputs jitter erratically within an 8ms window, turning precise player timing into random misses.
- Moving from 125Hz to 1,000Hz dramatically stabilizes your hit error bar. Moving to 4,000Hz or 8,000Hz tightens chord-split timings even further, offering a genuine competitive edge for top-tier rhythm players.
3. Typing Speed & Productivity
If you are typing code, writing articles, or working in an office:
- Even at a blistering 180 words per minute (WPM), you are generating approximately 15 characters per second—or one keystroke every 66 milliseconds.
- A standard 1000Hz polling rate samples inputs 66 times faster than your fingers can physically move.
- 8000Hz polling rate delivers zero perceptible benefit for typing speed or ergonomics. If your keyboard feels sluggish while typing, the culprit is almost always OS software delay, wireless interference, or Bluetooth throttling. For troubleshooting steps, see our Guide to Fixing Keyboard Input Lag & Delay.
4. The Hidden Cost: CPU Interrupt Load & DPCs
Running peripheral polling rates above 1000Hz is not free. Every time a keyboard or mouse sends an 8000Hz stream, it fires 8,000 hardware interrupts per second into the CPU:
- On modern multi-core processors (AMD Ryzen 7000/9000, Intel 13th/14th Gen), modern kernel schedulers handle this workload easily.
- On budget or older CPUs (Intel 9th Gen or older, AMD Ryzen 2000/3000), 8000Hz polling can flood core 0 with Deferred Procedure Calls (DPCs).
- In CPU-intensive titles like CS2 or Apex Legends, this interrupt barrage can cause 1% low frame drops, micro-stutters, and mouse hitching. If you experience frame drops after enabling 8kHz, drop the polling rate to 2000Hz or 4000Hz.
8. How to Benchmark and Measure Your Keyboard Latency
Can you test your keyboard’s scan rate or latency inside a web browser? Here is the honest technical reality:
What Online Browser Testers CAN Do
Using browser JavaScript APIs (performance.now(), KeyboardEvent.timeStamp), specialized diagnostic tools like our Keyboard Latency Test and Key Switch Test Suite can accurately measure:
- Key Chattering & Double-Strikes: Measuring the millisecond gap between consecutive key activations to identify failing switches or inadequate debounce filters.
- Key Interval & Chord-Split Times: Measuring how close two keys pressed simultaneously actually register in the browser event queue.
- Rollover & Matrix Blocking: Verifying whether 6KRO or NKRO correctly registers multi-key combinations without dropped inputs.
What Online Browser Testers CANNOT Do
No web browser can directly measure a keyboard’s raw physical scan rate or hardware polling rate in isolation. Here is why:
- The browser runs inside an operating system event loop.
- JavaScript timers are clamped by browser security sandboxes (typically microsecond quantization to prevent Spectre-style timing attacks).
- Windows or macOS message dispatchers queue keyboard events through the OS window manager before handing them to the browser window.
How Hardware Testing Laboratories Measure True Latency
Professional hardware review labs (such as RTINGS and Blur Busters) measure keyboard latency using specialized physical test benches:
- The Beagle 480 USB Protocol Analyzer: Placed inline between the keyboard and PC to record the exact nanosecond a USB HID packet hits the wire.
- Dual-Channel Digital Storage Oscilloscopes (DSOs): Channel 1 connects to an optical beam break or electrical probe on the key switch stem; Channel 2 connects to the USB data line ($D+/D-$). The time delta between physical contact closure and the USB packet arrival reveals the exact internal hardware processing delay.
- 1000 FPS High-Speed Cameras: Recording the physical moment a keycap is tapped alongside a high-refresh monitor to measure complete click-to-photon screen latency.
9. Actionable Buyer’s & Configuration Checklist
If you are shopping for a new keyboard or optimizing your existing setup for the lowest possible latency, use this checklist to avoid marketing traps:
Priority 1: Switch Technology (Most Impact)
- Best: Hall Effect (Magnetic) or Optical switches with zero debounce delay and adjustable actuation depth.
- Good: Mechanical switches paired with firmware that supports fast eager debouncing or adjustable debounce sliders (e.g., QMK/VIA custom boards).
- Avoid: Cheap membrane boards or low-end mechanical boards with locked, high-latency 10ms–15ms debounce filters.
Priority 2: Firmware Architecture & Scan Rate
- Check whether the manufacturer discloses internal matrix scan rate or ADC sampling speed.
- Look for an internal scan rate of at least 2,000Hz on mechanical boards and 4,000Hz–8,000Hz on Hall Effect boards to ensure Rapid Trigger features function at peak fidelity.
Priority 3: USB Polling Rate
- 1,000 Hz is the universal sweet spot for 98% of gamers. It delivers a sub-millisecond polling interval (0.5ms average wait) with virtually zero CPU performance overhead.
- 2,000 Hz to 4,000 Hz provides modest timing jitter reduction for top-tier competitive rhythm or tactical FPS players without overloading older CPUs.
- 8,000 Hz should only be selected if your system features a modern high-core-count CPU, you are playing at 240Hz+ display refresh rates, and your keyboard already features contactless switches with an 8kHz internal scan rate.
Priority 4: USB Port Connection
- Always connect high-polling-rate keyboards directly into a rear motherboard USB 3.0/3.2 port connected to the primary CPU or chipset root hub.
- Avoid plugging gaming keyboards into unpowered external USB hubs, monitor passthrough ports, or front-panel chassis extensions, which introduce signal degradation and shared bus latency.
Frequently Asked Questions
Can a keyboard’s scan rate be higher than its polling rate?
Yes, and it should be. High-performance keyboards commonly scan their internal matrix at 4,000Hz to 16,000Hz while polling over USB at a standard 1,000Hz. This ensures the microcontroller detects your keypress in the earliest possible microsecond, preparing a verified HID report so it is ready the moment the host computer requests it.
Can an 8000Hz keyboard cause frame drops in games?
Yes. Transmitting 8,000 reports per second places substantial interrupt load on CPU core 0. In CPU-heavy games like Valorant, Counter-Strike 2, or Call of Duty: Warzone, systems with older or budget processors may experience micro-stuttering or frame pacing anomalies. Lowering the polling rate to 2000Hz or 4000Hz typically resolves the issue immediately.
Does Bluetooth support 1000Hz polling?
No. Standard Bluetooth HID connections are bandwidth-constrained and operate at approximately 125Hz to 133Hz (an 8ms polling interval), often accompanied by battery-saving sleep states that add further wake-up latency. For competitive gaming, always use a wired USB connection or a dedicated low-latency 2.4GHz wireless dongle.
Conclusion & Diagnostic Next Steps
Keyboard responsiveness is not governed by a single marketing specification. High USB polling rates are only the final transmission leg of an intricate multi-stage journey.
If your goal is absolute minimum input latency, prioritize switch architecture and debounce firmware first, ensure the internal scan rate matches or exceeds the transmission rate, and select a polling rate of 1000Hz to 4000Hz that your CPU can sustain smoothly.
Ready to check your current keyboard’s responsiveness and switch health? Run our interactive Online Keyboard Latency & Debounce Test Tool now to measure key activation intervals, detect switch chatter, and verify rollover performance in real time.